Overview
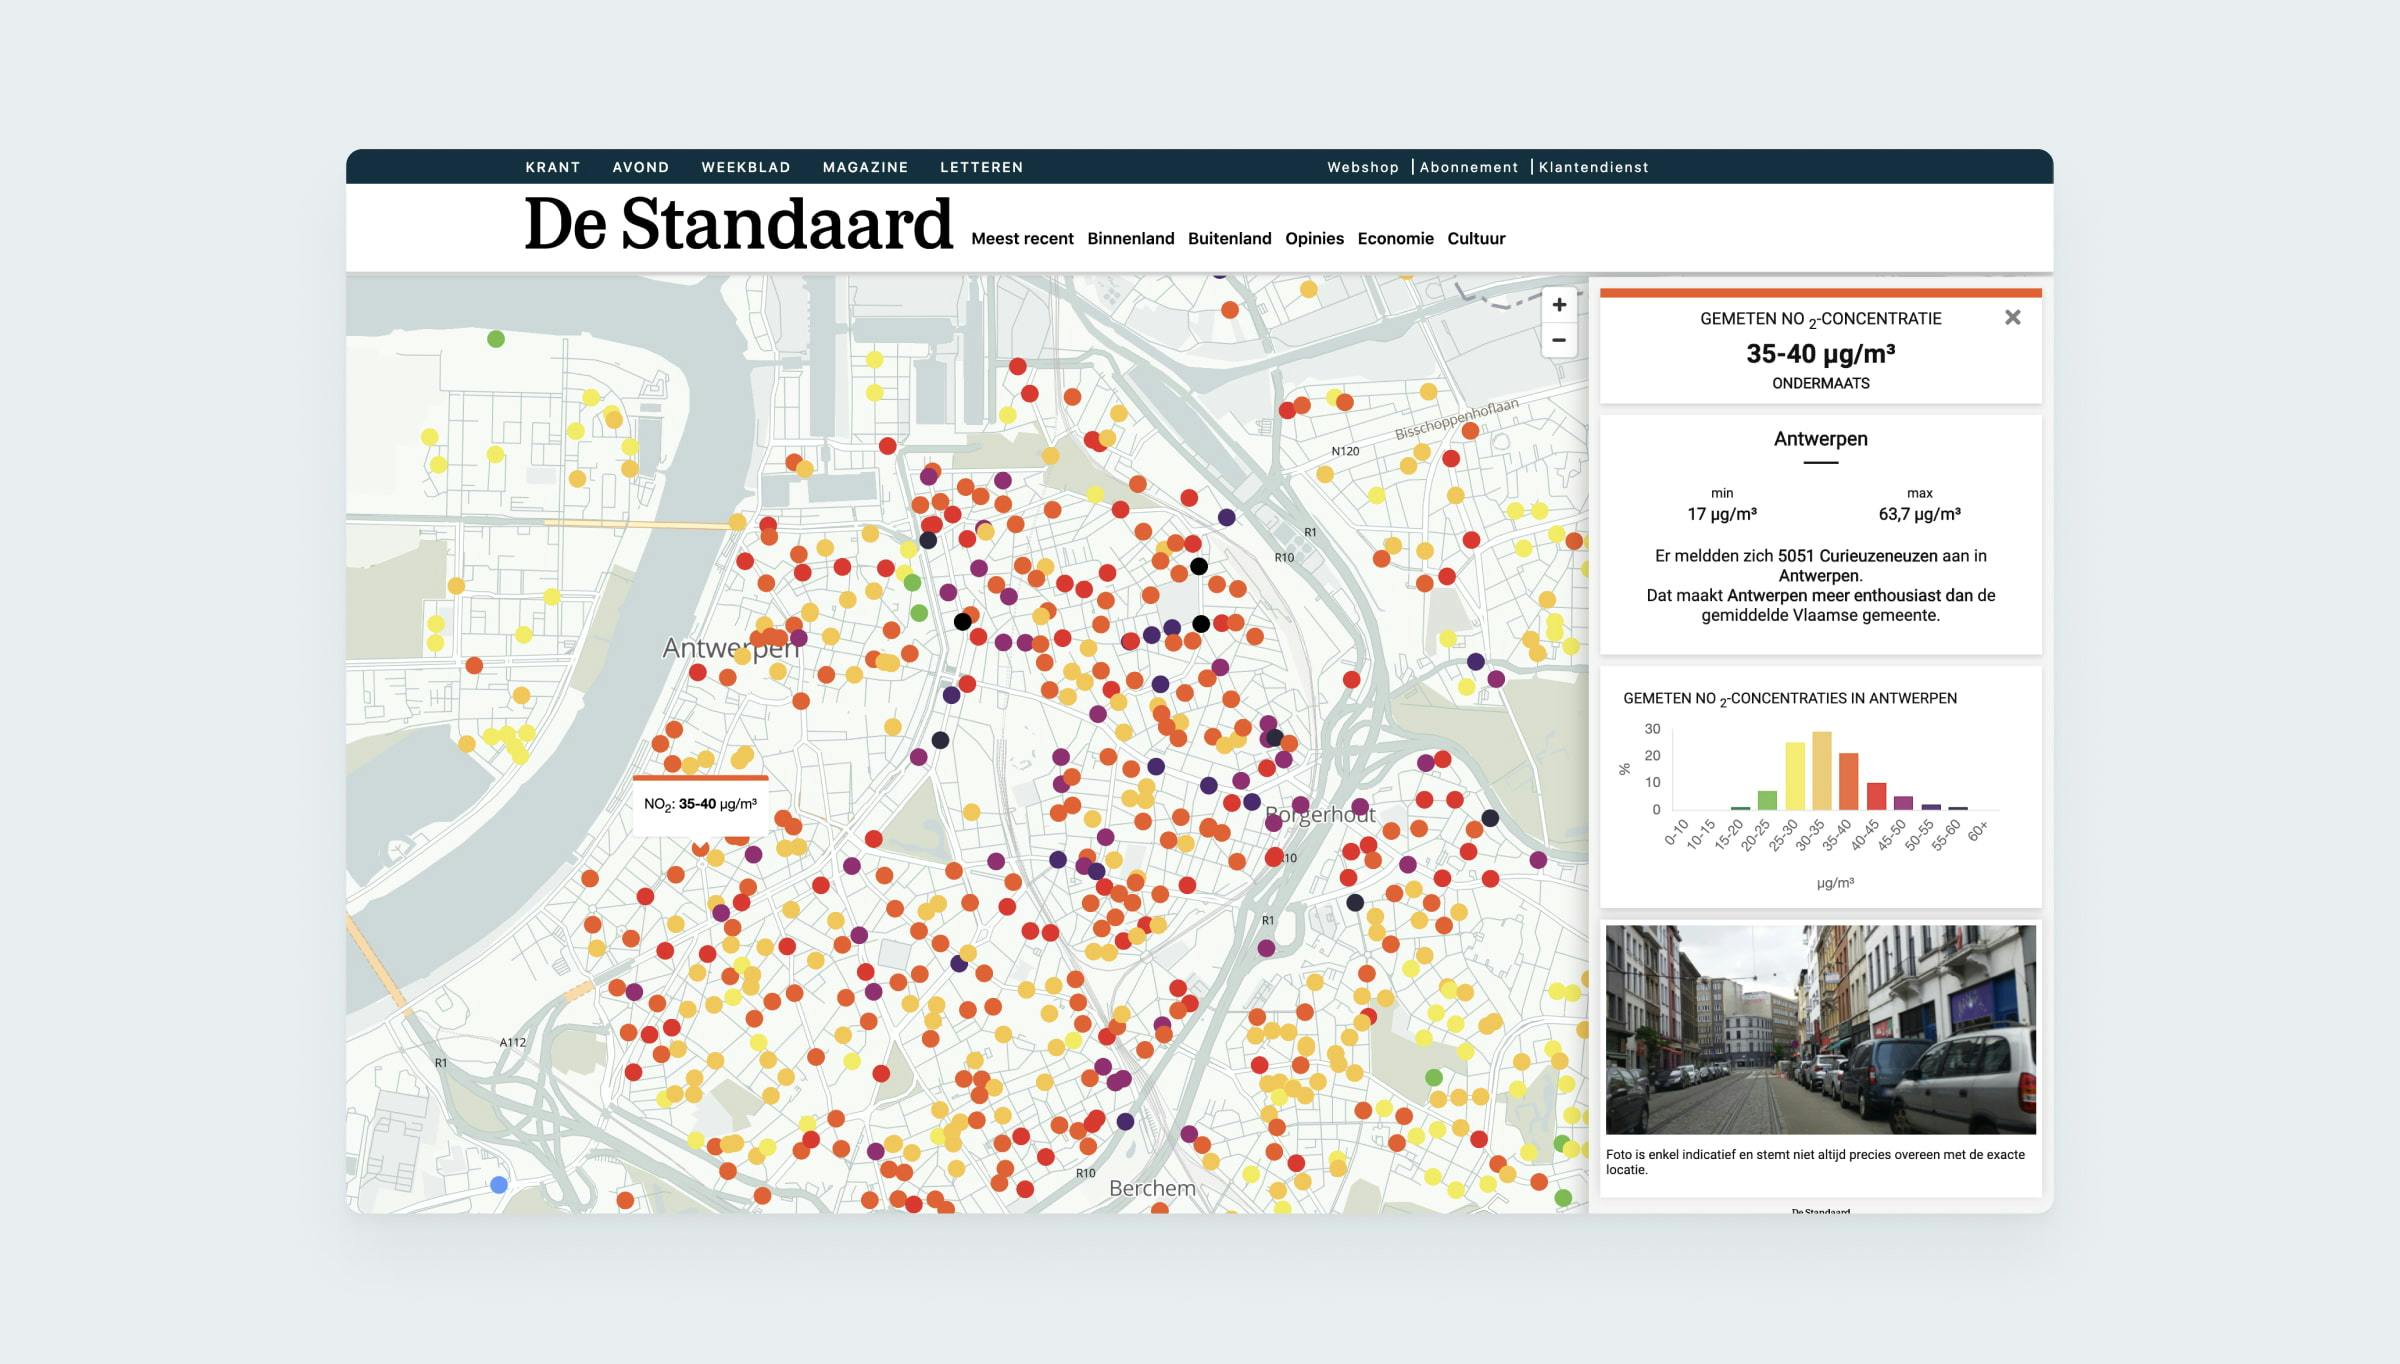
De Standaard is on of the leading newspapers in Belgium. In 2018, I've helped them with designing and building an interactive map with 20.000 data points spread over the cities, towns, and countryside of Flanders mapping the air pollution created by cars. Visitors could search for the dot on the street for their house, their parents' and their children's school.
Approach
After a kick-off meeting where we gathered all requirements, I started with creating wireframes, mapping out the user experience. After validating the wireframes, I designed a prototype that was used to gather early user feedback.
During this project I, together with another developer, had the opportunity to take the responsibility on the technical part. Giving me the chance to create an end-to-end solution that met the editorial team's requirements.
Used technologies
- HTML5
- CSS3
- Javascript
- Mapbox
- Custom Tile Server
Result
On launch day only, 650.000 unique visitors spent 1 million minutes on this map. Making it the most visited application in the publisher's digital history and eventually resulting in winning a 'Belfius Persprijs' in the category of Digital Press.